Get satellite imagery for your service
Crop identification with Machine Learning
Get satellite imagery for your service
Vegetation Indexes for Agriculture
Get satellite imagery for your service
Digital maps of arable lands (fields) are an integral part of any modern service, helping to manage spectacularly single of farm economy and agricultural region generally. Digital maps are used in monitoring of sowing condition, in systems of exact arable farming, in differential application of fertilisers, in inventory of agricultural appointment of lands, in assessment of risks in insurance activities, in evaluating and forecasting of yields, in control of misuse of lands agricultural purposes and others.
We offer electronic maps of arable lands, which are made by result on working of multi-temporal space images Sentinel-2. While creating of circuit we use object oriented approach - image segmentation and classification using a neural network.
Accuracy of classification in practically all cases is over than 90%, all contours are topologically correct and don’t have overlaps and self-intersections.
Data presented as vector layer in one of the most popular formats. There is an attribute, making available to assess the degree of reliability of assigning the contour to arable lands in structure of attributive information.
Making digital maps of Fields, usually made in expert mode, using space images or aerial photography data, including unmanned aerial vehicles, or by detour path with specialised geodetic equipment. It is quite labour intensive and expensive process. Besides, making maps for huge area, for example, in regional scale need a lot of time.
We introduce product, based on modern technologies of machine learning and computer vision, using process of space images at different times and programs Sentinels-2. It made substantially possible reduce the spending of time on creating field maps, consequently to decrease cost of the product.
The methodology, which is used by us is based on the object-oriented approach, widely used in automated decoding of space images, consisting of two main stages - segmentation and classification.
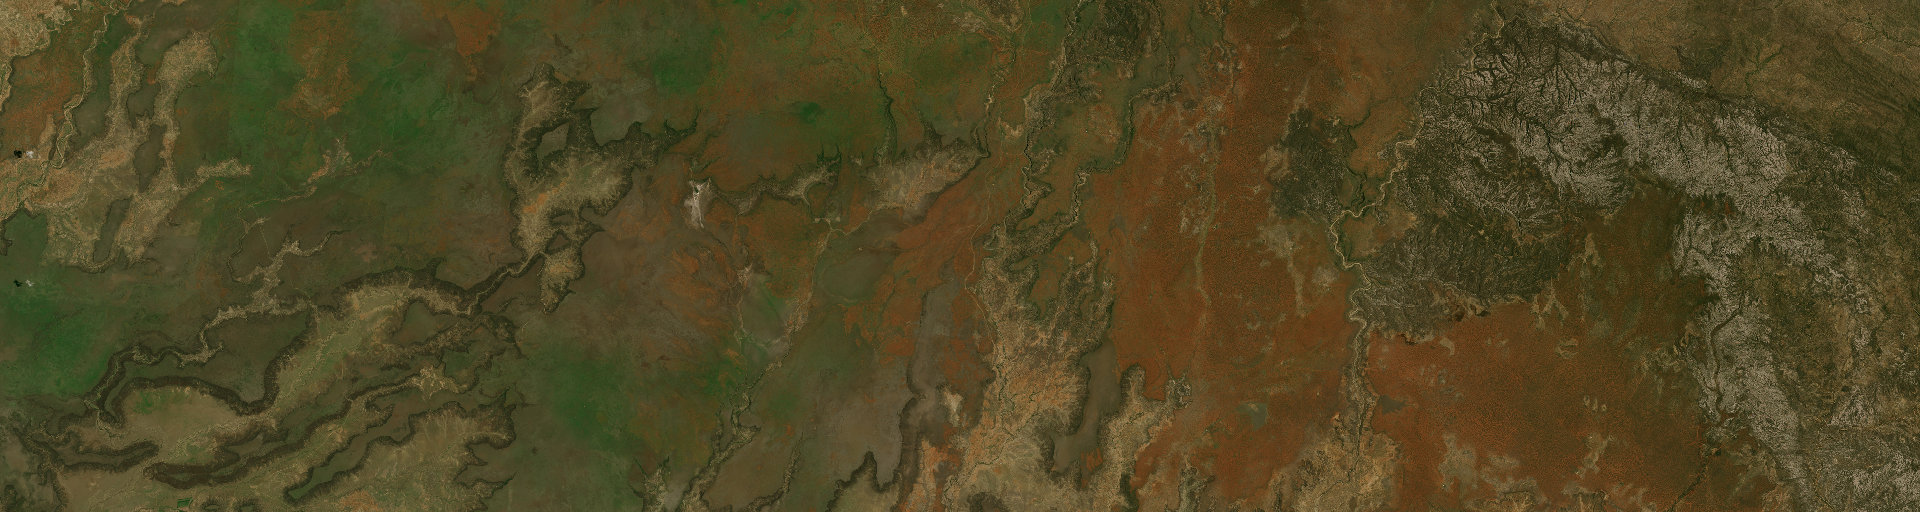
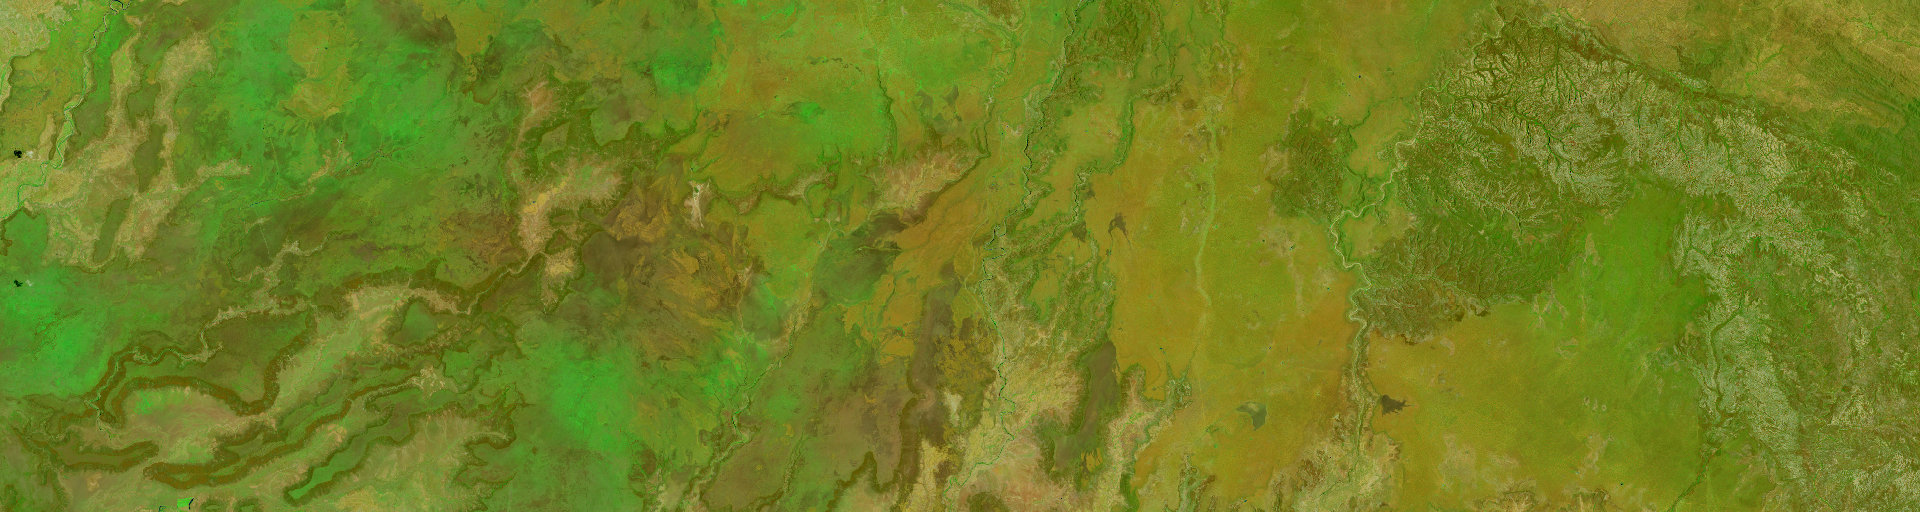
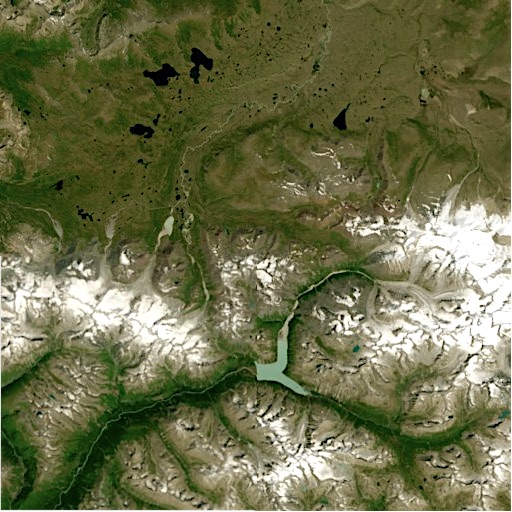
Segmentation - combining the original image pixels into adjacent areas, the so-called super-pixels. There are several generally accepted approaches for obtaining super-pixels, in our case, this is the WaterShed algorithm, while the maximum values of the NDVI vegetation index gradient are used as the boundary condition (the maximum of the function), and the values of the NDVI index are used as the marker (minimum of the function) corresponding to the open soil (less than 0.2).
 |  |
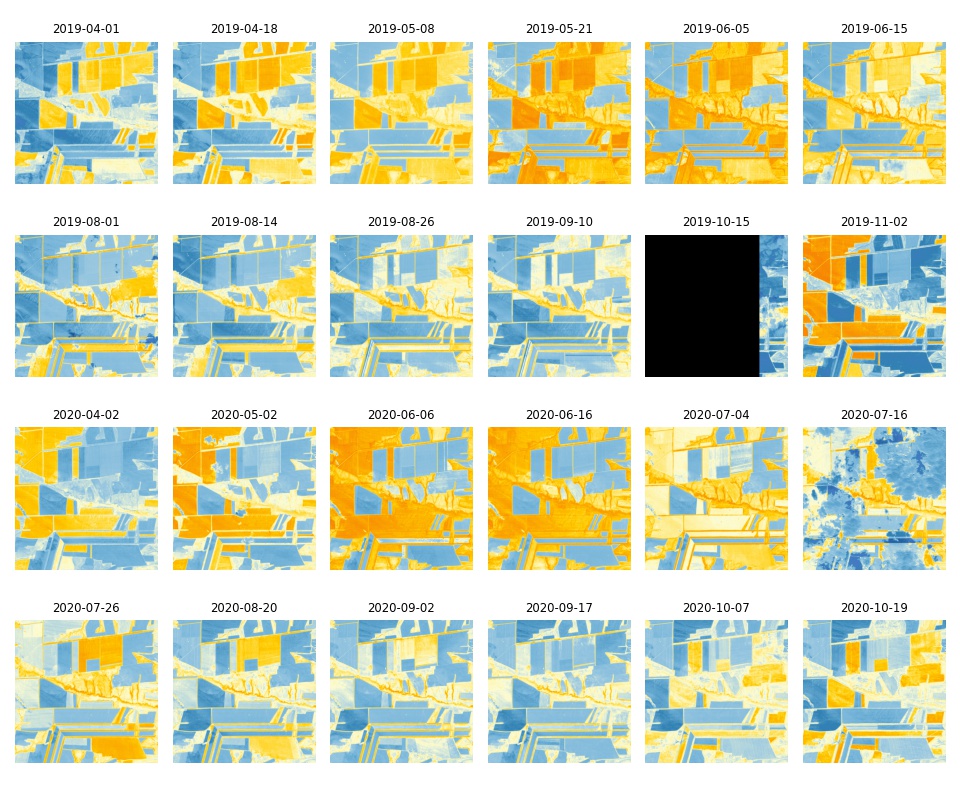 | 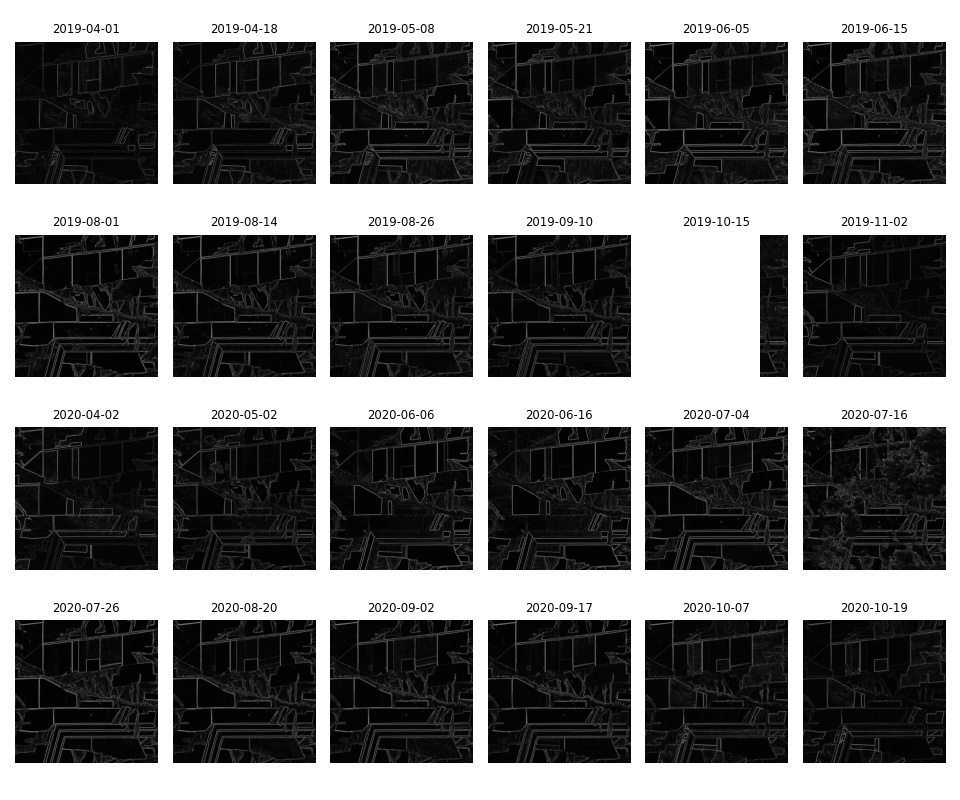 |
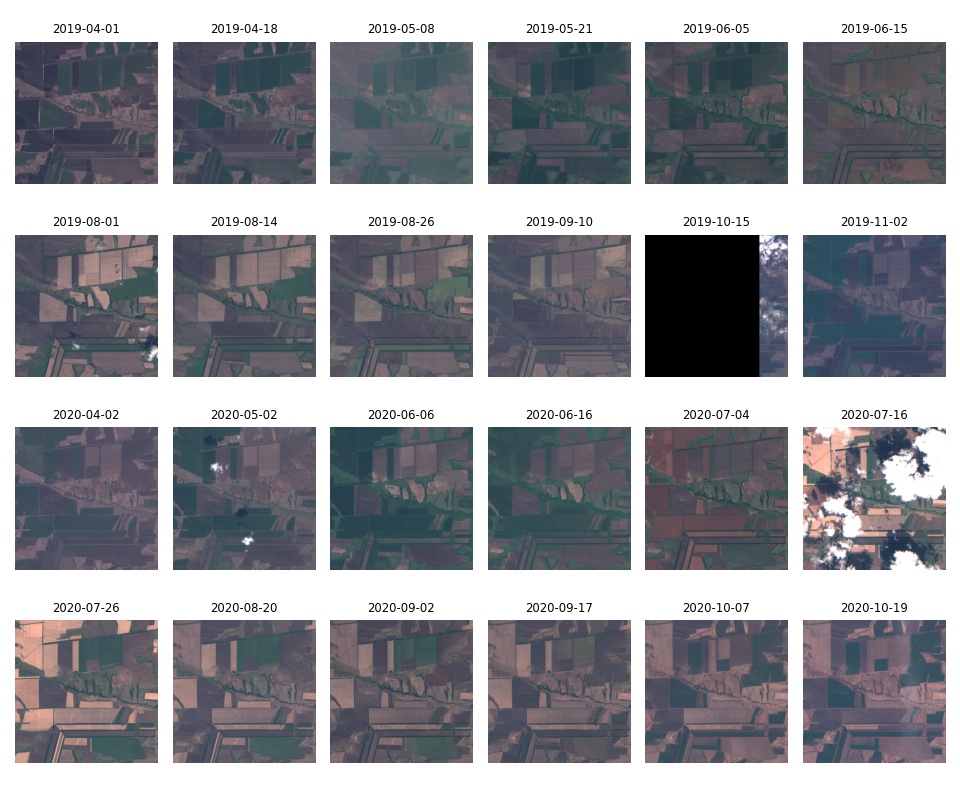
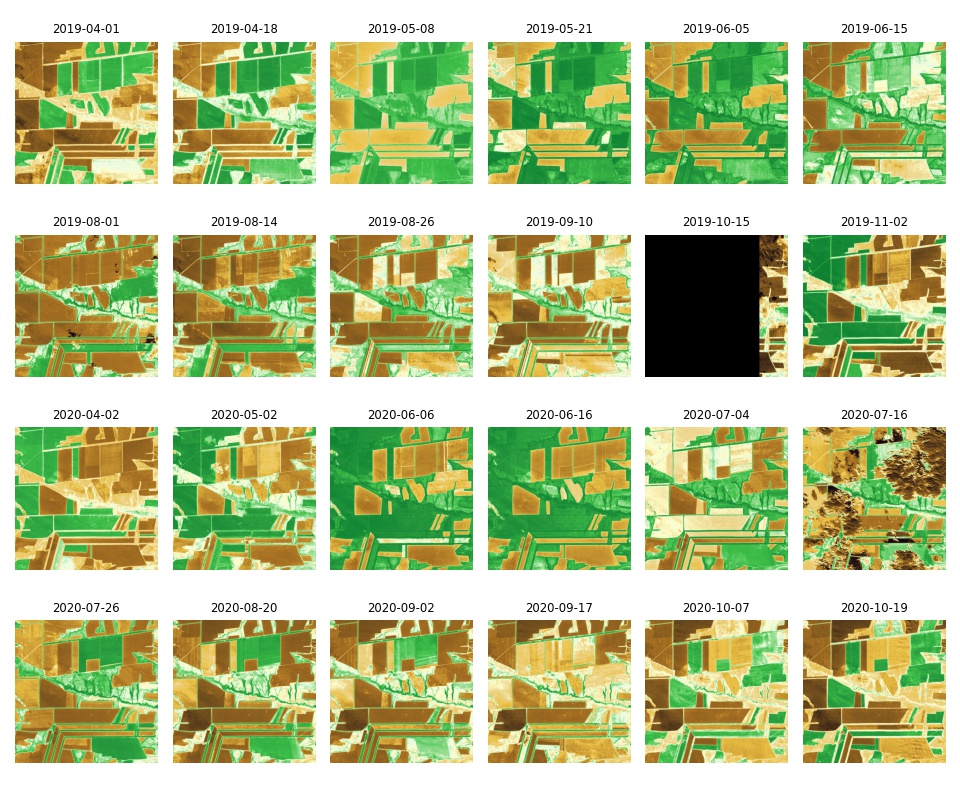
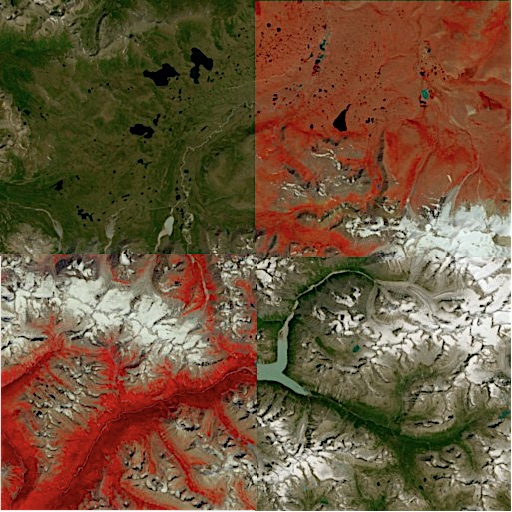
To ensure the uniformity of segmentation (the maximum possible coverage of the processed region with segments), this process is performed iteratively over a series of satellite images at different times, made for two agricultural seasons.
 |
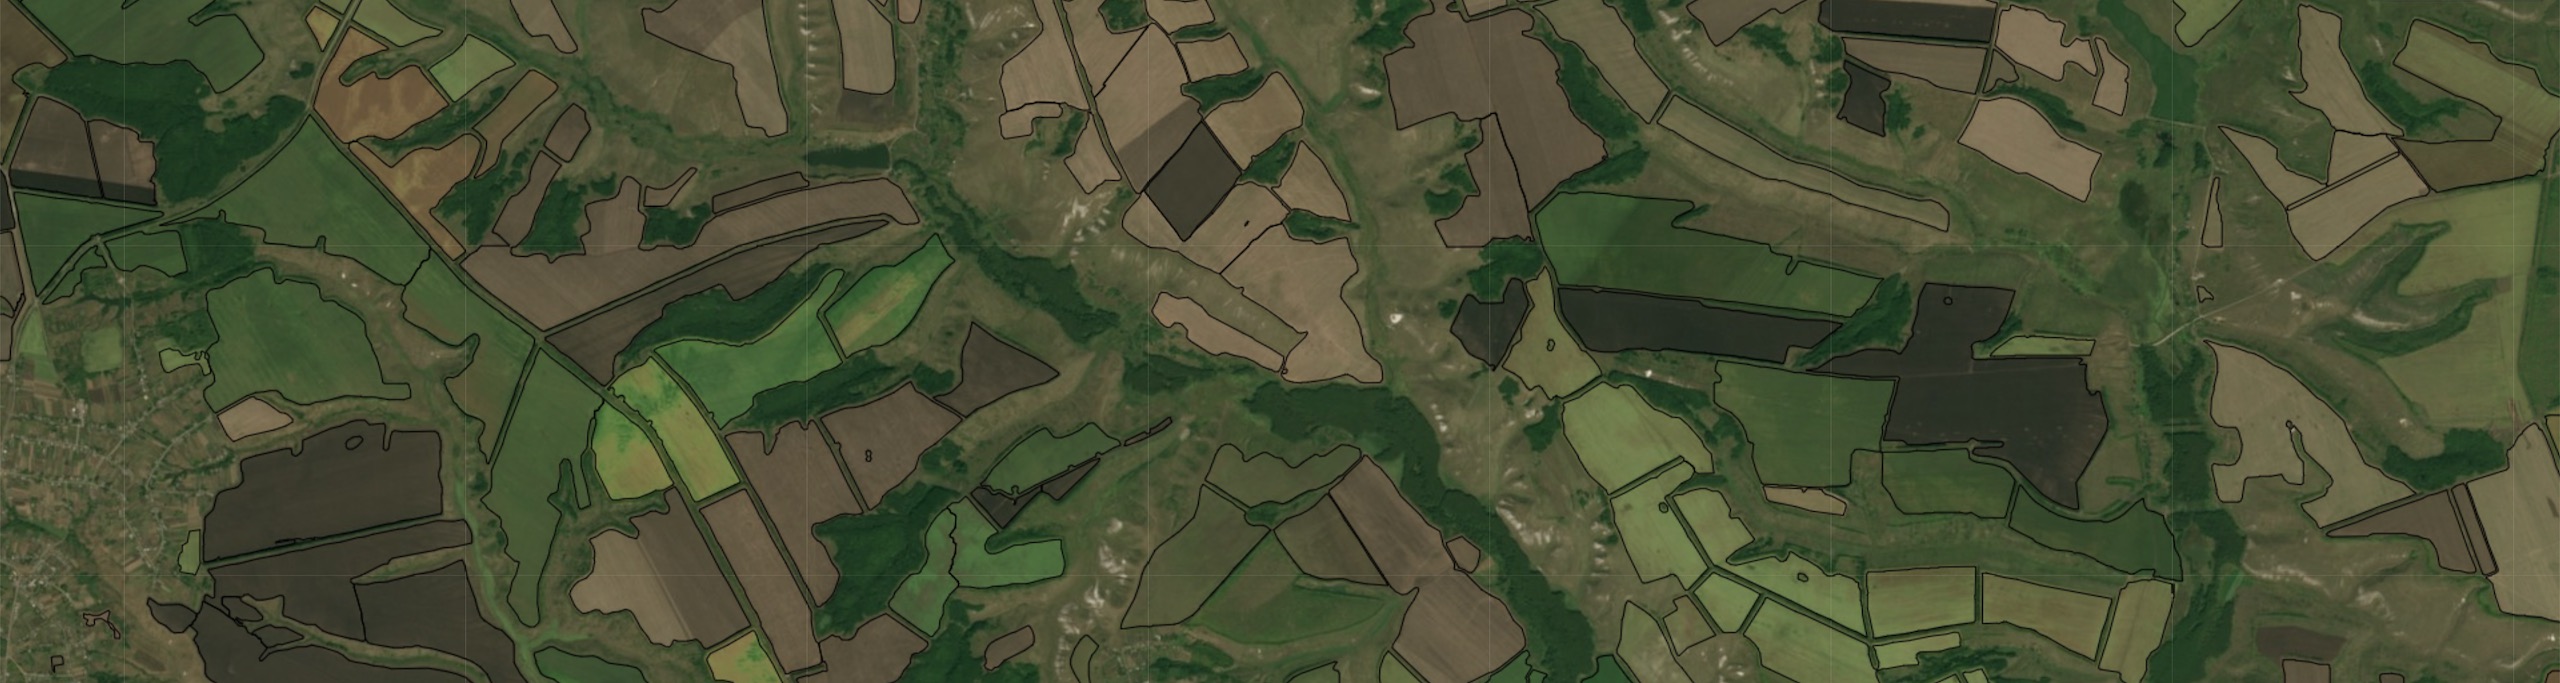
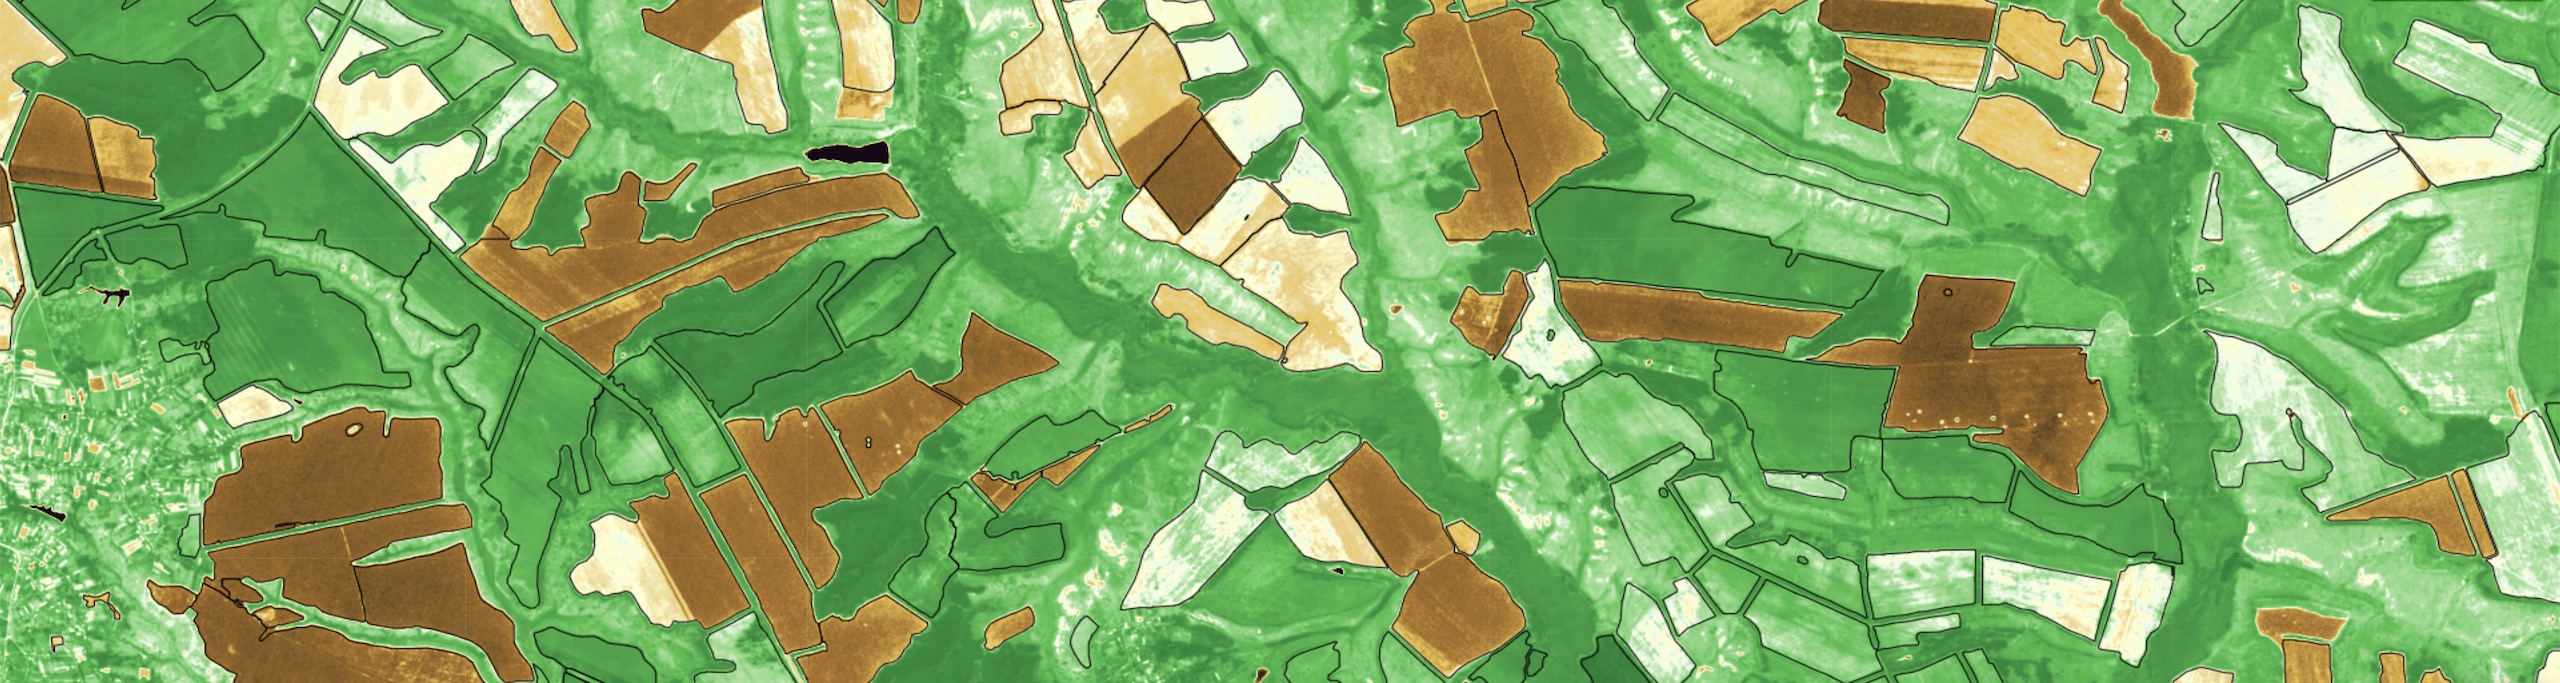
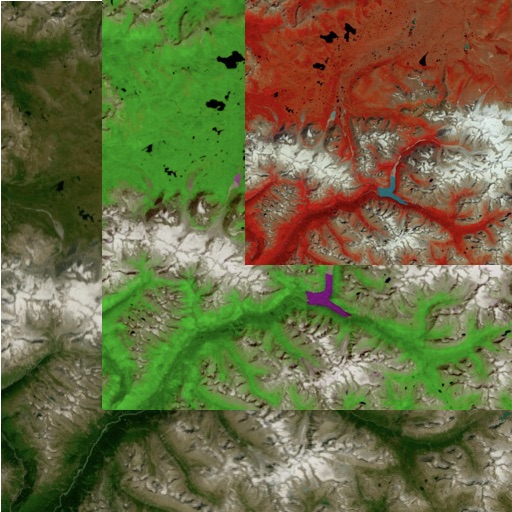
Classification - assignment getting from segments to the target class (arable lands). Super-pixels obtained at the stage of segmentation can be formed both by arable lands and by other natural or man-made objects, for example, water surface, buildings and roads, quarries, as well as by objects located under the shadows of clouds. A classifier is used to distinguish among all the obtained segments, those that relate to arable lands. In our case, this is a fully connected feedforward neural network (MLP) trained on a large (more than 10 thousand) set of hand-labeled examples. The following are used as classification signs: the dynamics of changes in the NDVI and NDWI index, the value of the gradient along the border of the segment, the spread of the values of the indices and the gradient, characteristics of the shape of the segment.
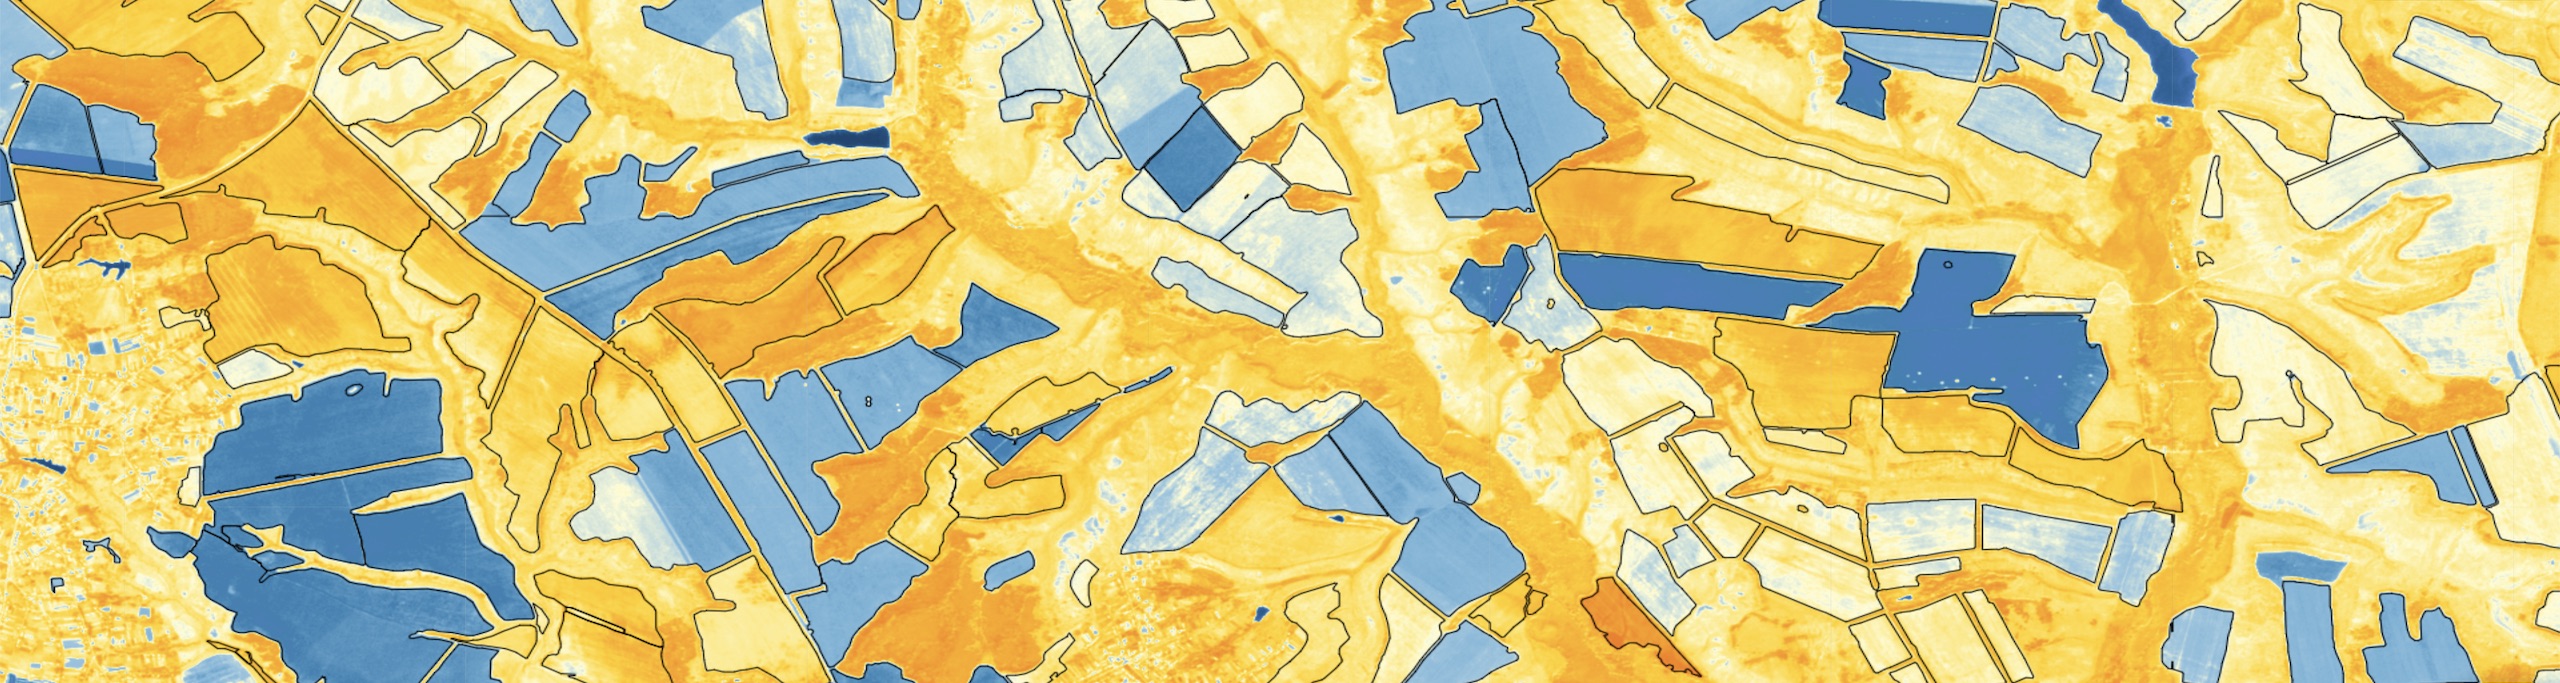
As a result, each obtained segment is assigned class 1 or 0 (arable land or other), and the value of the probability of assigning this segment to the class. Then, vectorization is carried out - the translation of segments to a vector form of representation, for the possibility of analysis and display in GIS packages and web services.
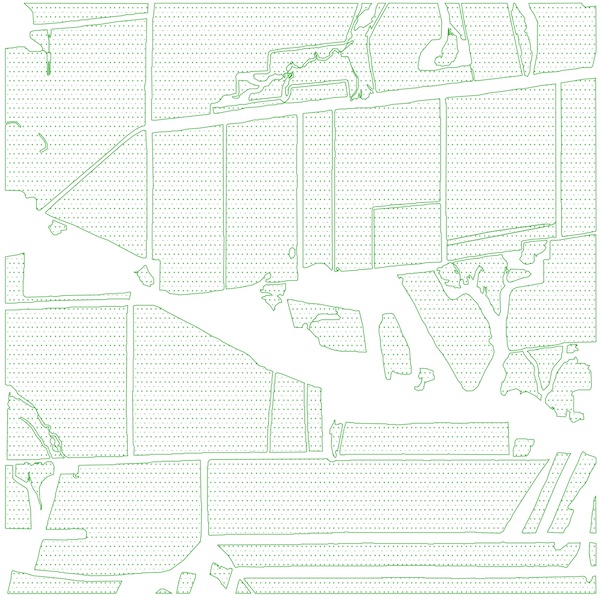 |
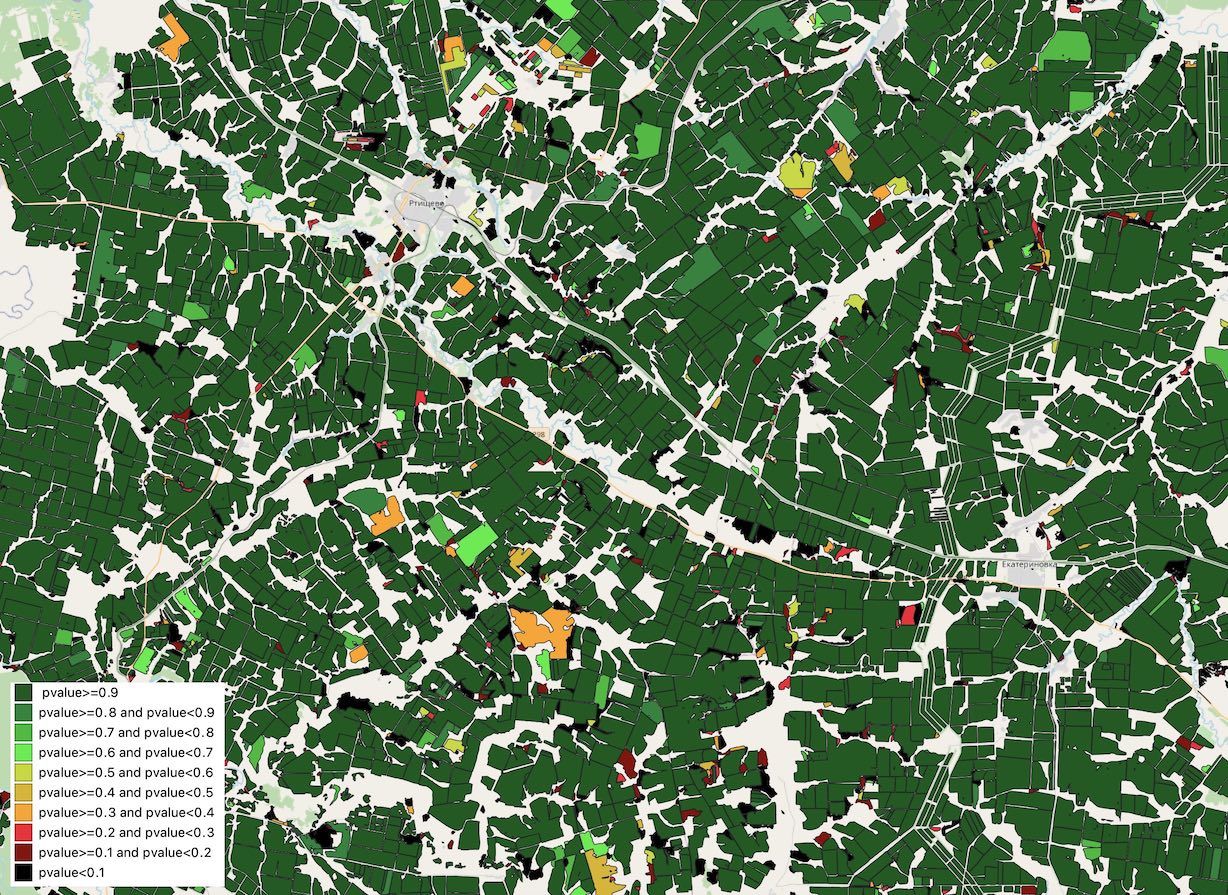
The attribute information of a vector layer contains information about the probability of assigning each contour to arable land, which allows data analysis at various levels of significance.
Below you can see examples of processing results for the Saratov region located in Russian Federation
 | 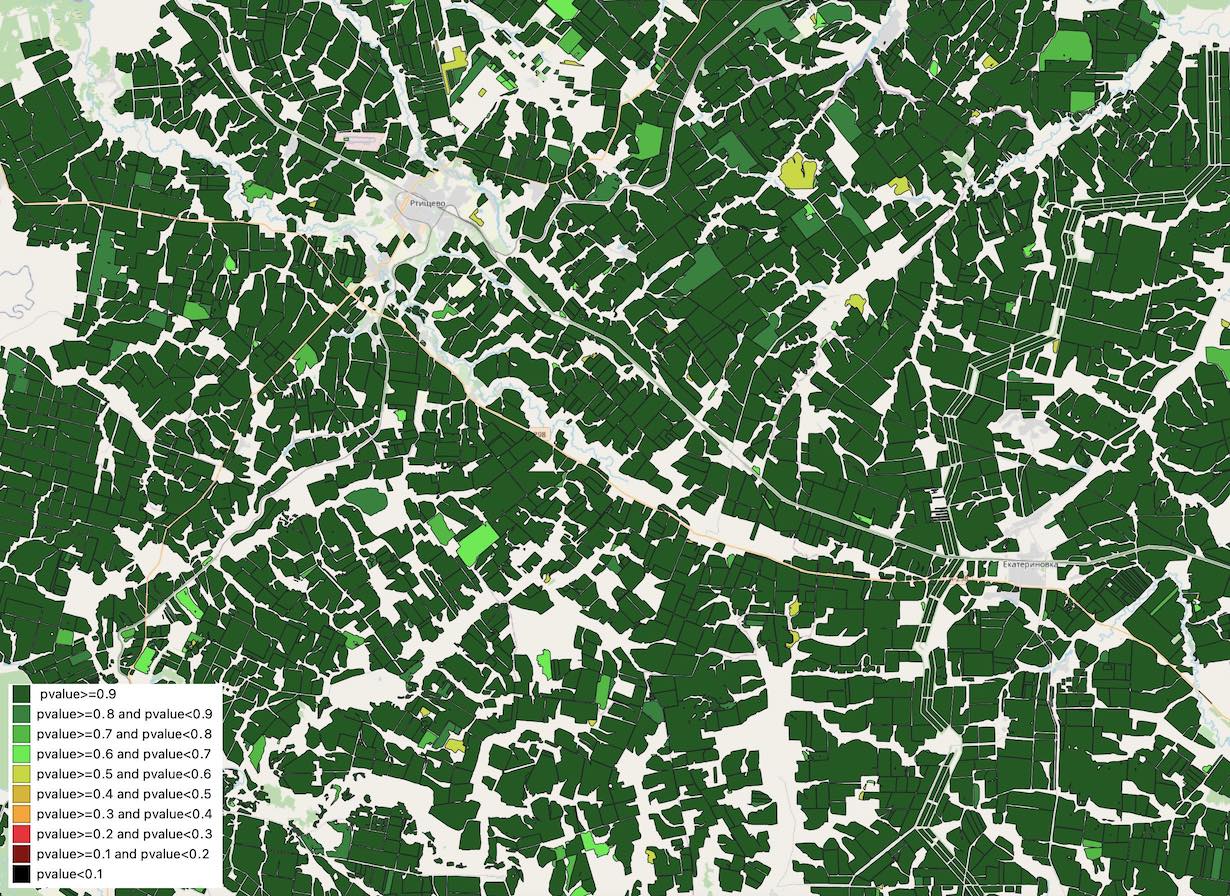 |
We are constantly increasing the number of processed territories, at the moment, their area is more than 200 million hectares include Russian Federation, Belarus, Ukraine, Moldova, Uzbekistan, Tadjikistan, Latvia, Lithuania, Estonia, Slovakia, Hungary.
If you want to purchase the contours of the fields for certain regions, or order the processing of your territory, write to us. We are ready to provide examples for the territory of your interest as soon as possible.
Contact us
info@opendatabox.info
Read our news in telegram and social media
Facebook
t.me/OpenDataBox_pub
Linkedin
View en example
Online DEMO with crop parcels boundary for four different regions in Europe and Russian Federation
Contact us
info@opendatabox.info
Read our news in telegram and social media
Facebook
t.me/OpenDataBox_pub
Linkedin
We offer the most recent and historical coverage of high resolution satellite imagery available in the public domain.
If you need a satellite map layer, we suggest using the view-ready product, which is provided as fully-prepared RGB images in popular formats.
For users who want to use the data for analysis, we offer the analysis-ready product, which is available in 4-channel (Nir, Red, Green, Blue), 16-bit images in GeoTIFF or JPEG-2000 formats.
View an example of the regional coverage
Sentinel-2 best cloudless coverage of the Russian Federation for 2018-2019 years. It is the best choice for GIS mapping or base layer of the web-service.
View an example of the multi-season coverage
Sentinel-2 cloudless two-season 2020 coverage of the Middle Asia. It is best choice for seasonal changes studying.
View an example of the multi-temporal coverage
Sentinel-2 cloudless coverage of the Kaliningrad region for 2018, 2019 and 2020 years. It is the best choice for change detection.
Contact us
info@opendatabox.info
Read our news in telegram and social media
Facebook
t.me/OpenDataBox_pub
Linkedin
View ready
8 bits RGB, view ready
Realistic looking color correction
Natural color or False color
Web Mercator tiles
GeoTIFF, JPEG-2000 for GIS users
API (coming soon)
Analysis ready
16 bits, analysis ready
4 channels Nir, Red, Green, Blue
GeoTIFF, JPEG-2000
API (coming soon)
Data analysis
Agriculture
Forest
Change detection
Water resource